Read the latest issue of The Dairy Bar, a bi-weekly report from IDFA partner Ever.Ag. The Dairy Bar features spotlight data, key policy updates, and a one-minute video that covers timely topics for the dairy industry.
The Dairy Bar: Per Capita Dairy Consumption Data; Rising Shipping Rates; and a New Year Outlook in a Minute!

Quick Bites: Front Loading Efforts, Port Jitters, Shipping Rates Rising
- Reports suggest some companies are looking to front-load trading and shipping activity in advance of prospective tariffs in 2025. President-elect Donald Trump recently announced plans to place 10%-20% tariffs on all goods from foreign countries, along with an additional 10% tariff on all goods out of China and a 25% tariff on products from Mexico and Canada. The countries are the first-, second- and third-largest sources of U.S. imports, respectively.
- As a result, importers who can afford to store extra product are ordering more ahead of January. Those who don’t purchase additional goods may find themselves paying more and passing the costs on to consumers if tariffs are enacted.
- Even as U.S. buyers import more goods, uncertainty is brewing at key ports. Maritime employers and a dockworkers union are currently discussing the use of automation at East and Gulf Coast ports. They face a January 15 deadline to come to an agreement, or dockworkers could strike.
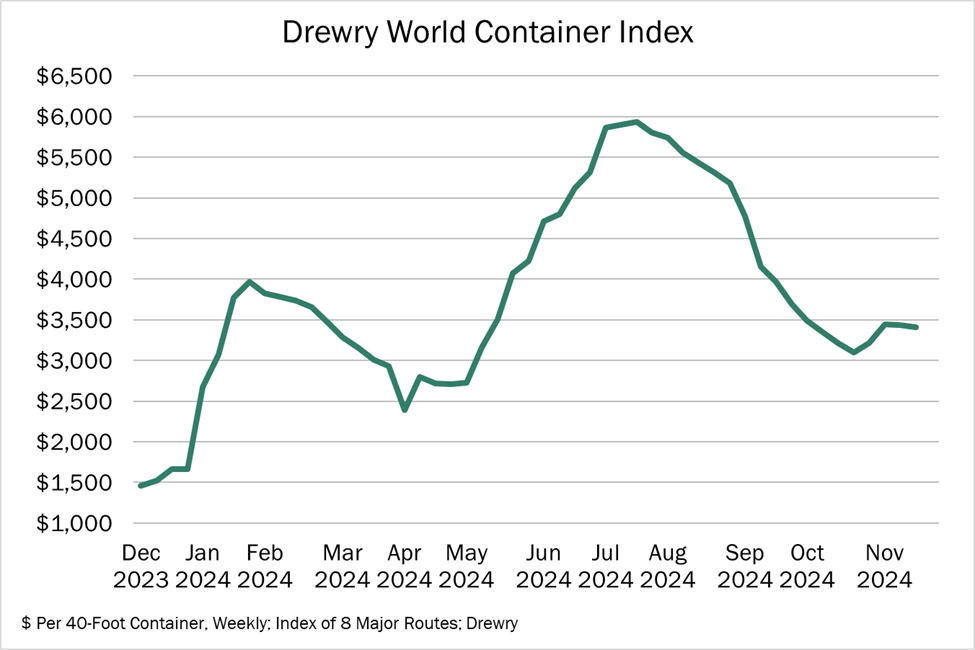
- Amid the uncertainty, ocean shipping rates are elevated. Rates from China to the U.S. West Coast reached $4,131 per 40-foot container as of December 2, up 150% year-over-year. The Drewry World Container Index, a composite of eight global shipping routes, also climbed to $3,413 per FEU during the week ending November 21, 147% higher on the year.
Today's Special
- Americans consumed more dairy in 2023, on both a skim solids and milkfat basis. Per capita consumption totaled 661 pounds in milkfat terms, up 7 pounds or +1.1% year-over-year. Usage also rose to 525 pounds on a skim solids basis, 2 pounds higher or +0.4%.
- After declining between 2021 and 2022, per capita butter consumption rebounded in 2023. Usage increased to a notable 6.5 pounds last year, up 0.4 pounds (+6.6%) from 2022. Over the last 10 years, consumption has increased by an average of 18%. Early indicators also point to healthy butter demand in 2024. Year-to-date through October, retail butter sales climbed more than 2% year-over-year.
- Cheese consumption was also robust in 2023, with total cheese usage at 42.3 pounds. That was up 0.5 pounds or +1.2% on the year. American-type cheese consumption was particularly strong at 16.8 million pounds, a gain of 0.5 pounds or +3.1%. On average over the past 10 years, total cheese consumption has climbed nearly 19%, while American-type usage rose more than 25%. More strength is likely ahead – during the first 10 months of this year, retail natural cheese sales increased nearly 3%.
- Looking at soft products, the consumption of yogurt and cottage cheese climbed. Yogurt usage totaled 13.8 pounds, up 0.3% or +2.2% between 2022 and 2023. Whether due to social media, dietary trends or both, cottage cheese consumption rose to 2.1 pounds, 0.2 pounds higher or +10.5%. Over the last 10 years, yogurt consumption has declined by 7%, while cottage cheese usage is relatively flat.
- Performance was softer across fluid milk and regular ice cream. Continuing a nearly 40-year trend, fluid milk usage totaled 128 pounds, a loss of 2 pounds or -1.5% between 2022 and 2023. Since 1975, usage has dropped by more than 48%. Perhaps a reflection of the increasing popularity of GLP-1s, regular ice cream consumption also dropped to 11.7 pounds last year, a decrease of 1.1 pounds or -8.6% on the year. And, during the first 44 weeks of this year, retail ice cream sales are unchanged.

